Economic growth is a topic that central bank, government and corporate actors salivate over, which is all well and good, provided that the growth is organic and based on real, substantive free market conditions.
But what if the actual growth is not to the liking of these players, yet they wish to present the case that it is? How could they go about creating the illusion of growth if no such growth existed?
What is presented here is not a specific approach that may be taken, but the principle underlying what may be possible.
Hollow Out The Core To Maintain The Facade
Consider a solid sphere of say 100 millimetres (4 inches) in diameter, made from a particular substance. For this sphere to be able to grow in size, it would require more of the same material from which it is made to be deposited evenly on to its surface, then as this accumulation continues the greater its mass and diameter would become.
But suppose this material is in short supply or no longer available, how could the sphere then grow?
One may conclude that the sphere could not grow in size, because there is no material available to contribute to its diameter and therefore its mass.
Well, that is somewhat correct, there is no material available to add to its mass but there is material available that could contribute to its overall size.
If the intent is to only make the sphere larger in diameter, then an approach that could be taken to achieve this is to use the material at the core of the sphere and place it evenly onto the surface of the sphere. Thereby increasing its diameter whilst maintaining the same mass. The sphere would not be any heavier than it originally was, only larger.
So, if the purpose is to create the appearance of growth, then all One need do is transfer the mass at the core of the sphere and place it on the surface. Essentially, Hollowing Out the Core to Maintain the Facade; the facade of growth that is.
To the external observer the increase in size is seen as legitimate because the external observer is unable to see the inside of the sphere or feel the weight of the sphere. Either of these occurrences would give the game away.
However, the problem with this approach comes when the wall thickness becomes thinner and thinner the more this ruse is perpetuated. Eventually, the wall thickness becomes so thin that it is no longer be able to support its own weight and at that point the sphere will collapse in on itself, with the hoax then being exposed.
For instance, if One is to consider the above example of the 100 millimetre (4 inch) sphere, the increase in diameter that is possible by hollowing out its core in the manner suggested, is presented in Table 1 below.
| WALL THICKNESS (mm) | DIAMETER OF HOLLOW SPHERE (mm) | | | WALL THICKNESS (inches) | DIAMETER OF HOLLOW SPHERE (inches) |
|---|---|---|---|---|
| 50 | 100.0 | | | 2.000 | 4.000 |
| 40 | 100.3 | | | 1.750 | 4.003 |
| 30 | 102.5 | | | 1.500 | 4.022 |
| 20 | 110.6 | | | 1.000 | 4.215 |
| 10 | 139.0 | | | 0.500 | 5.110 |
| 5 | 187.6 | | | 0.250 | 6.780 |
| 2 | 290.7 | | | 0.125 | 9.362 |
| 1 | 409.2 | | | 0.063 | 13.126 |
| 0.50 | 577.9 | | | 0.031 | 18.506 |
| 0.25 | 816.7 | | | 0.016 | 26.144 |
| 0.10 | 1291.1 | | | 0.008 | 36.958 |
| 0.05 | 1825.8 | | | 0.004 | 52.260 |
| TABLE 1 |
To be clear, this table presents a condensed number of steps to get to a diameter of 1825.8 millimetres (52.260 inches) and a wall thickness of 0.05 millimetres (0.004 inches) by incrementally removing material from the inside of the sphere and transferring it to the surface. To achieve this in a practical and methodical manner would require thousands upon thousands of iterations. (Refer to the Clarification and Methodology sections at the end of this post)
What is to be noted with this example is the trend in behaviour, rather than the repetitious detail.
Starting with an original solid sphere diameter of 100 millimetres, it is possible to create a hollow sphere with a diameter of 1825.8 millimetres and a wall thickness of 0.05 millimetres by following the above approach.

Starting with an original solid sphere diameter of 4 inches, it is also possible to create a hollow sphere with a diameter of 52.26 inches and a wall thickness of 1/256 inches by following the above approach.

As a comparison, the image below shows the relative size difference of the original solid sphere and the largest hollow sphere presented in Table 1.
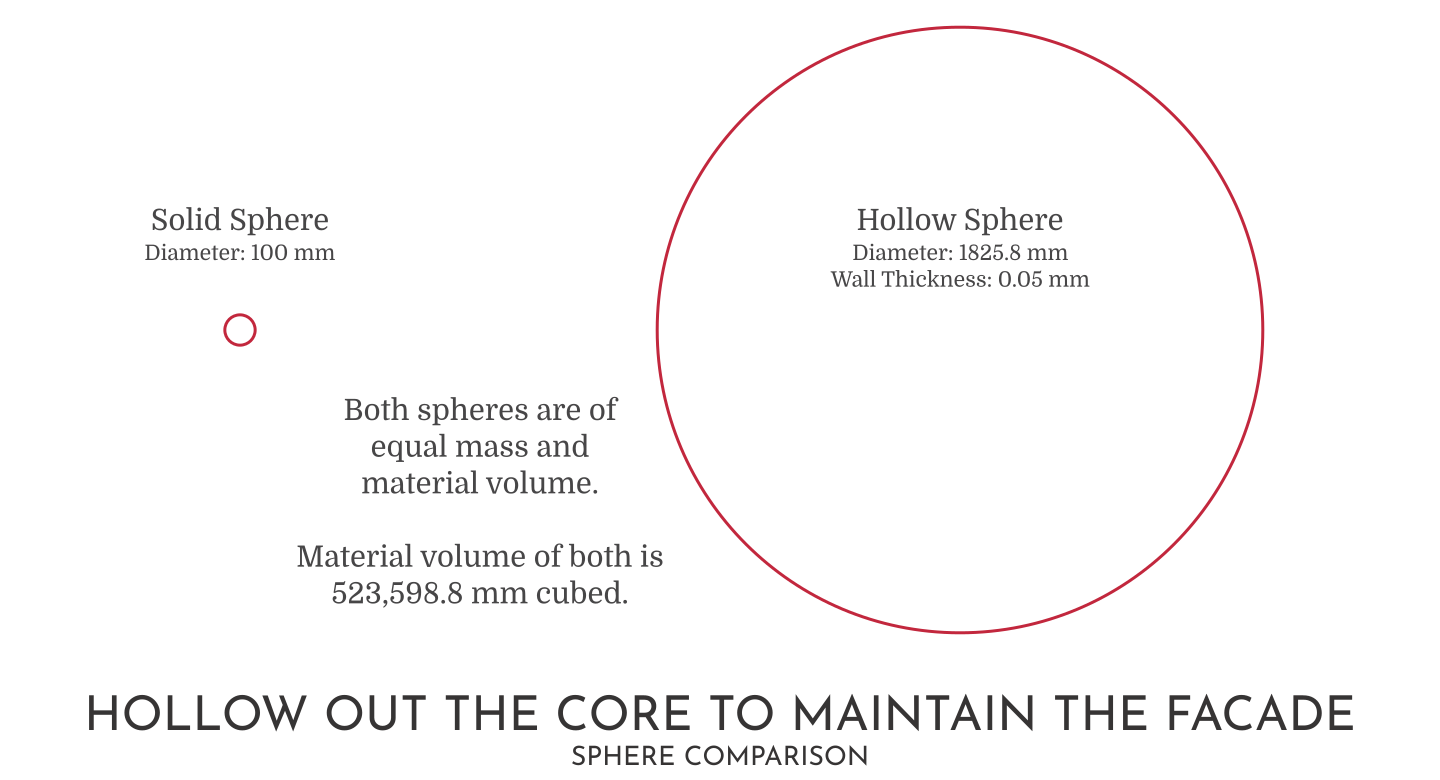
Obviously, the external diameter of the sphere can be made to appear impressively large. But what may not be so apparent at face value, is that the sphere lacks any real substance. All its mass is spread out onto its flimsy skin, resulting in a thin veneer, ready to collapse.
The only question is,
“How long before it collapses?”
In an economic context, what is the primary instrument that is used to Hollow Out the Core to Maintain the Facade?
The Central Bank.
Clarification
The tables and charts presented in this post are based on a constant volume, constant density premise. That is, the mass is unchanged as the outer diameter and wall thickness changes. So if the same material is being transferred from the core to the outer surface, then the material volume does not vary.
Methodology
The process summary for Hollowing the Sphere is as follows;
Iteration 1
Step 1 – Start with a Solid Sphere Diameter.
Step 2 – Determine the Solid Sphere Volume.
Step 3 – Select the Core Diameter.
Step 4 – Calculate the Core Material Volume.
Step 5 – Calculate the Increase in Diameter.
Step 6 – Calculate the Wall Thickness.
Iteration 2
Step 1 – Determine the Diameter for Material Removal.
Step 2 – Calculate the Material Volume for Removal.
Step 3 – Calculate the Increase in Diameter.
Step 4 – Calculate the Wall Thickness.
Iteration 3 and on
Repeat Iteration 2 until the desired number of iterations is reached.
For a more in-depth explanation of the process and calculations that were developed to produce these tables and charts, refer to the Hollowing The Sphere Calculations document.
Table 2 below has been compiled to give an indication of the enormous number of steps required to get to the 0.05 millimetres wall thickness entry in Table 1, using this methodical approach.
| ITERATION NUMBER | WALL THICKNESS (mm) | DIAMETER OF HOLLOW SPHERE (mm) |
|---|---|---|
| 0 | 50.000 | 100.00 |
| 1 | 27.002 | 104.00 |
| 2 | 18.177 | 113.36 |
| 3 | 13.926 | 123.03 |
| 4 | 11.436 | 131.98 |
| 5 | 9.793 | 140.13 |
| 13 | 5.018 | 187.24 |
| 49 | 2.013 | 289.75 |
| 137 | 1.004 | 408.47 |
| 387 | 0.500 | 577.88 |
| 1091 | 0.250 | 816.73 |
| 1500 | 0.202 | 908.26 |
| TABLE 2 |
The chart below shows the trend line for the first 255 iterations of the full methodology.